
Advanced Green Tech for Sustainability & Compliance
Green Tech & ESG Compliance
Industry
10+ Members
Team members involved
Build your project
Book a free call
What was the requirement?
VisionGreen needed an innovative solution to help companies register, track, and improve their environmental impact and sustainability practices.
They sought to develop a robust portal for measuring carbon footprints, generating SDG (Sustainable Development Goals) reports, and managing other environmental goals. The portal had to offer detailed assessments, easy data integration, and insightful reports.
A few key issues!
Difficulty in measuring and managing carbon footprints and SDG compliance.
The need for detailed and actionable environmental reports.
Providing companies with tools to track and improve their sustainability goals.
Our Solution
We developed a comprehensive portal that integrates advanced IoT and AI technologies to help companies assess their environmental impact and meet their sustainability goals. The portal includes tools for SDG assessment, carbon footprint measurement, and more.
We integrated cutting-edge hardware with a robust, user-friendly software application designed to fetch, record, and analyse real-time data, enhancing the efficiency and accuracy of the entire process.
SDG Assessment Tool
The SDG assessment tool is designed to guide users through a four-step process. At every evaluation step, users will required to explain their priority within 200 words.
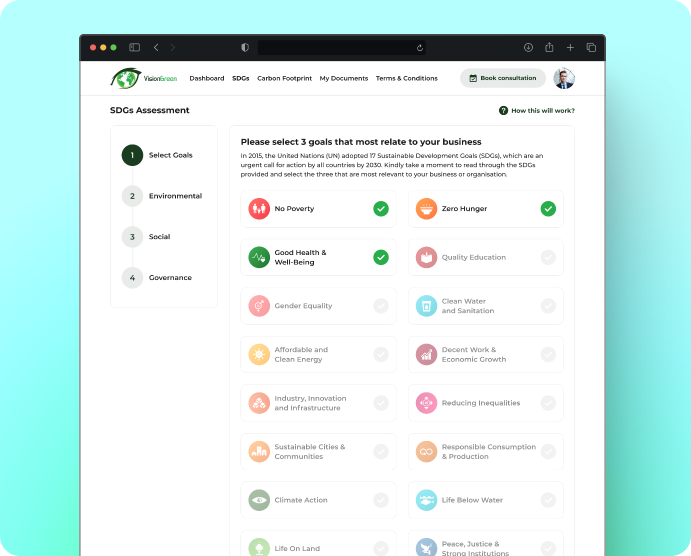
Select Goals
Users select 3 out of the 17 UN SDGs relevant to their business.
Environmental Evaluation
Rate priority of carbon footprint and biodiversity in terms of business relevance (Low, Medium, High).
Social Evaluation
Rate the priority of community impact in terms of business relevance (Low, Medium, High).
Governance Evaluation
Rate the priority of fraud, corruption, and money laundering in terms of business relevance (Low, Medium, High).
Upon submission, a detailed report is generated with graphs and action lists for each step. Companies can set and track goals to improve their sustainability practices.
Carbon Footprint Assessment Tool
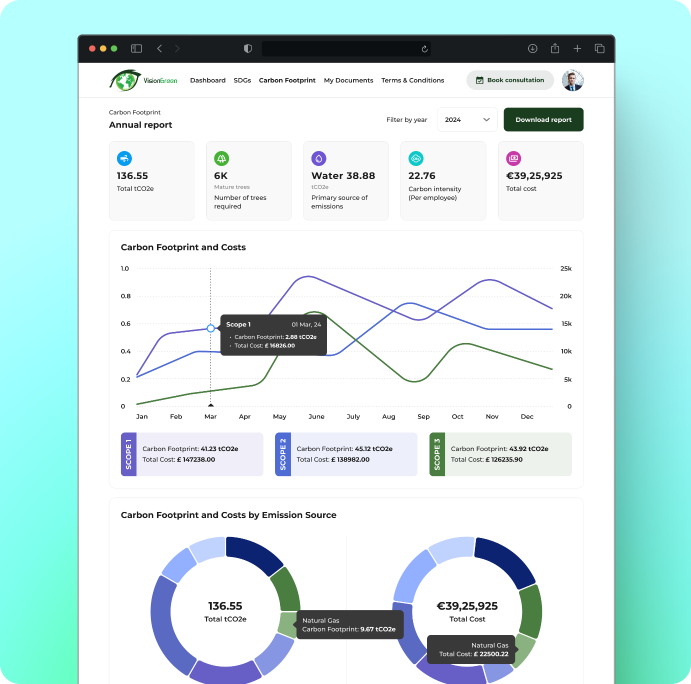
The carbon footprint assessment tool guides users through three detailed steps, enabling comprehensive tracking and management of carbon emissions. This structured approach ensures that all relevant data is captured, analyzed, and reported effectively.
General Information
Number of buildings, plants, products, raw material sources, and locations.
Logistics and Data Quality
Questions related to employee commuting, business travel, utility data ranking, own warehousing units, and third-party warehousing units.
Carbon and Sustainability
Generic info questions about on-site sustainability resources, project scope, and recommendations needed.
Users can upload data manually or via Excel, as the tool is engineered to fetch data from Excel sheets.
Detailed questions about Scope 1 (e.g., LPG, petrol), Scope 2 (e.g., electricity), and Scope 3 (e.g., business travel, waste) consumption.
After submission, the tool generates a comprehensive report with pie charts, graphs, and key insights such as total emissions, primary emission sources, and the number of trees required to offset the carbon footprint. Carbon intensity per employee is also calculated.
A few additional features!

Year-wise Reports
Users can view and download reports for different years.

User Dashboard
A holistic view of assessments, enabling users to book consultations via the portal.

Documents Upload
Users can upload the required documents such as utility bills.
Admin Dashboard
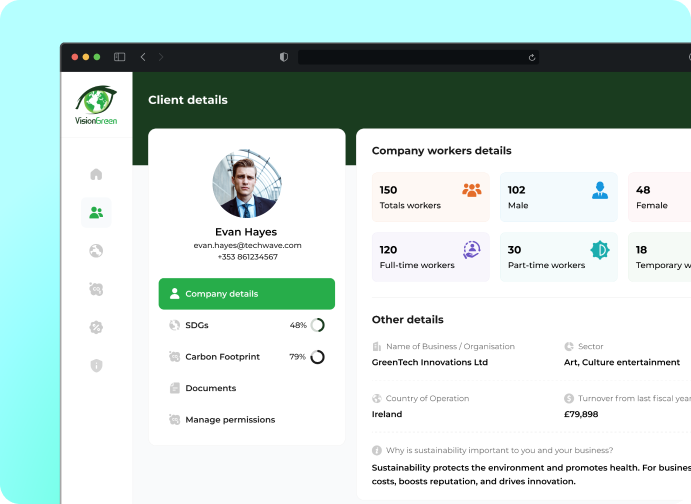
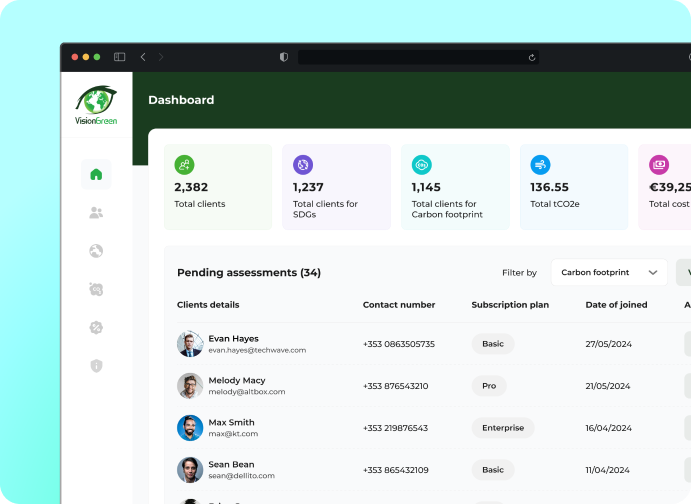
The Admin Dashboard provides comprehensive oversight and control over the entire compliance process. Key features include:
User Management
Admins can manage company accounts, including onboarding new companies, and updating user information.
Data Analytics
Real-time data analytics and visualization tools to monitor compliance metrics, track progress, and identify areas needing attention.
Reporting
Advanced filtering and reporting capabilities to generate detailed compliance reports, which can be exported in various formats.
Document Verification
Automated and manual verification processes for documents uploaded by companies, ensuring authenticity and compliance.
Audit Trail
Comprehensive logging of all activities within the portal, providing a clear audit trail for accountability and transparency.
Customisation
Ability to customise questionnaires, grading criteria, and reporting formats to address specific regulatory requirements.
Technical Development Highlights

Advanced IoT and AI Integration
Leveraged IoT technology for real-time data collection and monitoring.
Implemented AI algorithms for accurate document verification and data analysis.

User-Centric Design
Developed intuitive interfaces for companies, admins, and controllers.
Ensured a seamless onboarding process and user experience.

Robust Security Measures
Ensured encryption of all data both in transit and at rest.
Implemented multi-factor authentication for secure access.
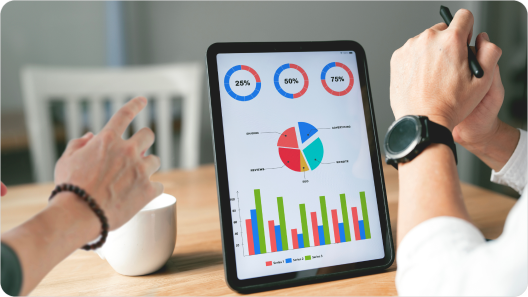
Real-Time Analytics
Provided real-time data processing and visualisation for informed decision-making.
Continuous learning algorithms to enhance data accuracy and system efficiency.
Outcomes & Impact
Enhanced Compliance Management
Enabled companies to track and manage their ESG compliance with 95% accuracy.
Improved the ability of companies to identify and address compliance gaps.
Better Emission Tracking
Enabled companies to accurately measure and monitor their carbon footprints.
Helped companies reduce their carbon emissions by a significant percentage.
Streamlined Goal Setting and Tracking
Increased effectiveness, with 70% of companies achieving their reduction targets.
Enabled companies to create and manage custom action plans.
Increased Efficiency and Accountability
Reduced manual data entry and verification efforts by 80% with AI-driven solutions.
Lowered operational costs by 60% by automating data collection and processes.
Technologies we used to build the platform
Frontend
Framework

React.js
Used for building responsive and scalable user interfaces.
Libraries

Redux
For state management.

Axios
For making HTTP requests.

Bootstrap
For UI components.
Backend
Language

Node.js with Express.js
For building a fast and scalable backend.
Authentication

OAuth 2.0
For secure authentication and authorization.
Database

PostgreSQ
For relational data.

MongoDB
For NoSQL data.
APIs

RESTful APIs
For standard operations.

GraphQL
For more complex data fetching.
Security

JWT (JSON Web Tokens)
For user session management.

Bcrypt
For password hashing.
Infrastructure
Cloud Provider

AWS
For scalable cloud infrastructure.
CI/CD

GitHub Actions
For continuous integration and deployment.
Containerization

Docker
For containerizing applications.

Kubernetes
For orchestration.
Monitoring & Logging
Monitoring

Prometheus
For monitoring application metrics.

Grafana
For visualization.
Logging

ELK Stack (Elasticsearch, Logstash, Kibana)
For centralized logging and analysis.
DevOps
Infrastructure as Code

Terraform
For infrastructure management.
Configuration Management

Ansible
For managing configurations.
Here’s what the client has to say!
Working with this team has greatly enhanced our capabilities. The portal they developed allows our clients to effortlessly track and manage their carbon footprints and sustainability goals.
The detailed reports and actionable insights have been instrumental in helping our clients achieve significant improvements in their environmental impact.
